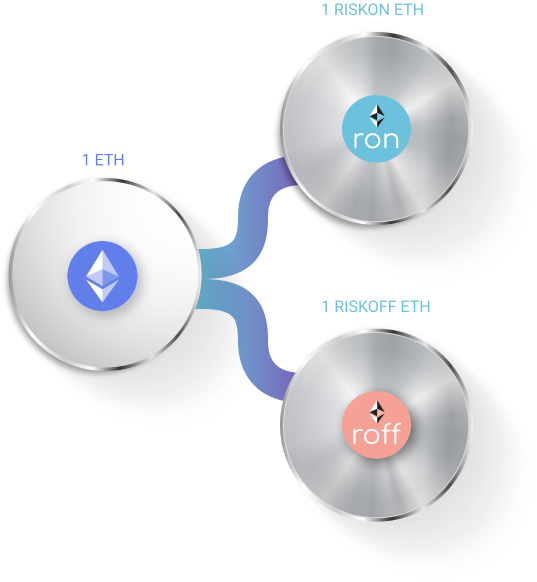
Levered exposure to ETH with no margin calls & no
liquidations
Specs:
- Long 50% of 1 ETH
- Short put at strike = 95% of starting price
- Long call at strike that makes value of put and call equivalent
- Monthly settlement
- Perpetual
Lower volatility and beta relative to ETH with limited
downside
Specs:
- Long 50% of 1 ETH
- Long put at strike = 95% of starting price
- Short Call at strike that makes value of put and call equivalent
- Monthly settlement
- Perpetual
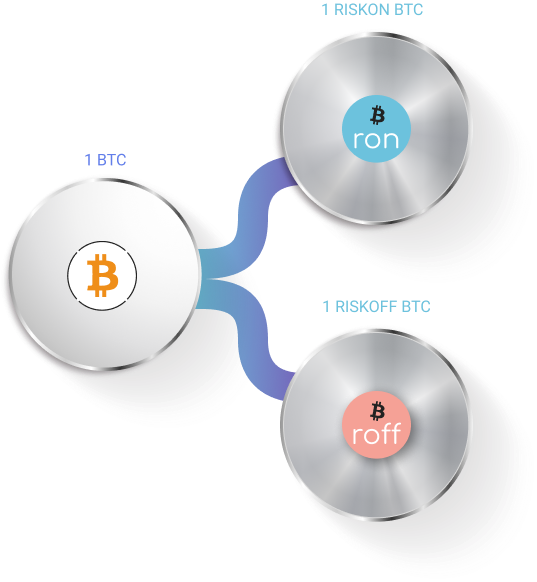
Levered exposure to BTC with no margin calls & no liquidations
Specs:
- Long 50% of 1 BTC
- Short put at strike = 90% of starting price
- Long call at strike that makes value of put and call equivalent
- Quarterly settlement
- Perpetual
Lower volatility and beta relative to BTC with limited
downside
Specs:
- Long 50% of 1 BTC
- Long put at strike = 90% of starting price
- Short call at strike that makes value of put and call equivalent
- Quarterly settlement
- Perpetual


